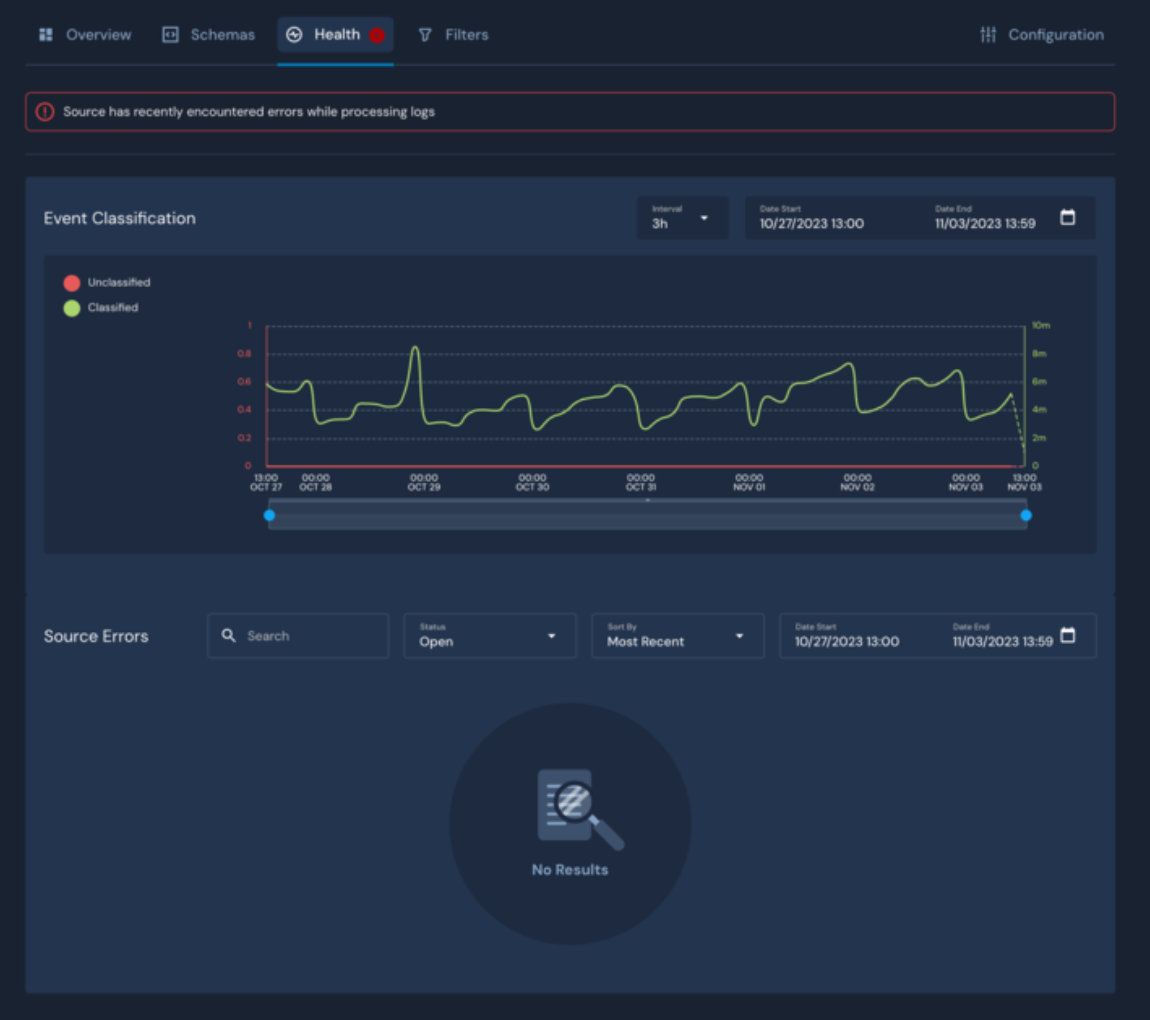
How do I resolve the CloudTrail error "Source has recently encountered errors while processing logs" in Panther?
Last updated: September 3, 2024
Issue
I have a CloudTrail log source with an error banner in the Panther Console that I am unable to clear. How can I troubleshoot the error Source has recently encountered errors while processing logs?

Resolution
To resolve this issue:
Run the following SQL query in Data Explorer, replacing the
YOUR_LOG_SOURCE_IDplaceholder with your actual log source id.
SELECT
  *
FROM
  panther_monitor.public.data_audit
WHERE
  p_occurs_since('3 days') and status != 'SUCCESS' and p_source_id = 'YOUR_LOG_SOURCE_ID'
ORDER BY p_event_time DESC
LIMIT 100;
To export the query results, click the “Download CSV” button above the results panel in the Data Explorer
2. If you see the following error in the query output, it may be due to digest files being added to your S3 bucket, which Panther is having trouble parsing.
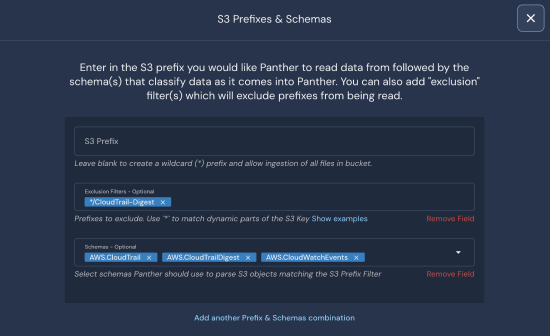
"""FAILURE""","""READ""","""stream CloudWatch logs: invalid stream: invalid cloudwatch event message type3. To fix this, you can add a prefix filter to exclude any log files with CloudTrail-Digest in the name, which will ignore all these files.

4. After making the change, please rerun the SQL query mentioned earlier to check if any errors persist after adding the exclusion filter.
5. If you've made changes and there are no more errors in the output, but you're still seeing the error banner, please note that the error banner may not disappear until 24 to 72 hours of no errors occurring.
6. If the steps above do not resolve the issue for you, please contact Panther Support with your CSV results, a screenshot of your exclusion configuration, and a sample of the digest logs from your S3 bucket for further troubleshooting.
Cause
This issue occurs because CloudTrail Digest uses a different streaming format compared to regular CloudTrail logs. Currently, Panther can't support both formats in the same log source.