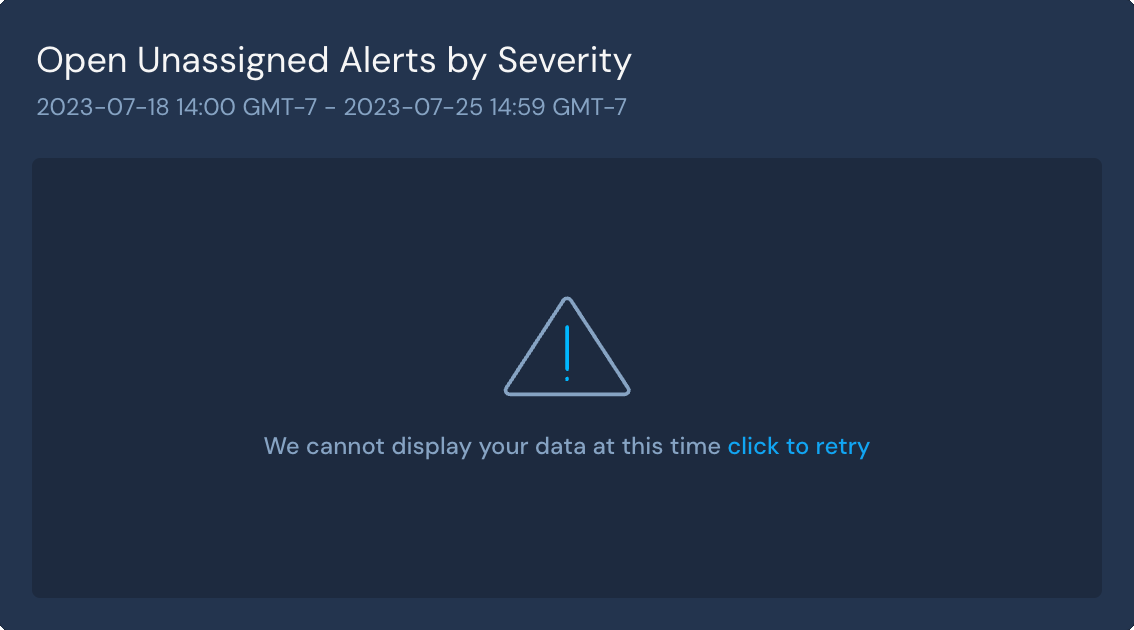
Panther dashboards fail to display, error message "We cannot display your data at this time, click to retry"
Issue
When viewing the main Panther dashboard, one or more of the visualizations are not showing data, instead displaying the following error:
Resolution
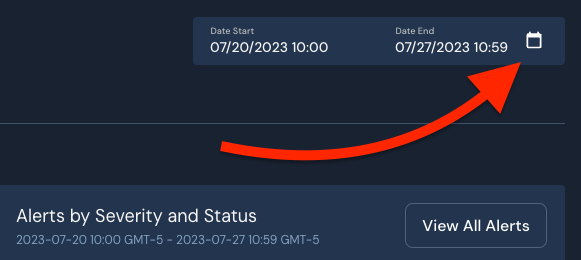
The #1 cause of this error message is that the visualizations have timed out. In most cases, you can resolve the issue by adjusting the dashboard's timespan to a smaller window. You can edit the timespan using the date picker in the upper right corner of the page:
Still not showing?
If you're still seeing the visualizations failing to load after reducing the timespan to less than 24 hours, then you may have a runaway detection. You can check this by opening the Data Explorer and pasting the following SQL query:
SELECT p_rule_id, count(*)
FROM panther_views..all_rule_matches
WHERE p_occurs_since('1 day')
GROUP BY p_rule_id
ORDER BY count(*) DESC
LIMIT 1000
The results will display the ID of each rule which has generated an alert in the past 24 hours, as well as how many alerts the rule has generated. If any of these numbers appear unusually large, then that rule may need tuning to produce less alerts.
Contacting Support
In cases where the above query isn't revealing any runaway detections, you may be experiencing an issue unrelated to alert volume. Contact our support team and inform them that you've worked through the steps of this article. They'll assist you in troubleshooting further.
Cause
This issue is often caused by a large number of alerts being processed. Each time the dashboard page is loaded, the Panther Console must retrieve all alerts which fall within the specified timespan and then compile them into these visualizations. Under normal volumes, this process is relatively fast, but when the volume of alerts is unusually large, such as when a poorly-tuned detection encounters a lot of log events, then the API calls to retrieve and process this data can timeout, resulting in the error shown above.
While Panther doesn't currently provide a method of deleting existing alerts, this problem is temporal in nature - once the noisy detection is fixed, then less alerts will be generated, and over the course of the next 2 weeks, the number of alerts the API calls must retrieve will decrease back to normal levels.