Panther UI elements are failing to load
Issue
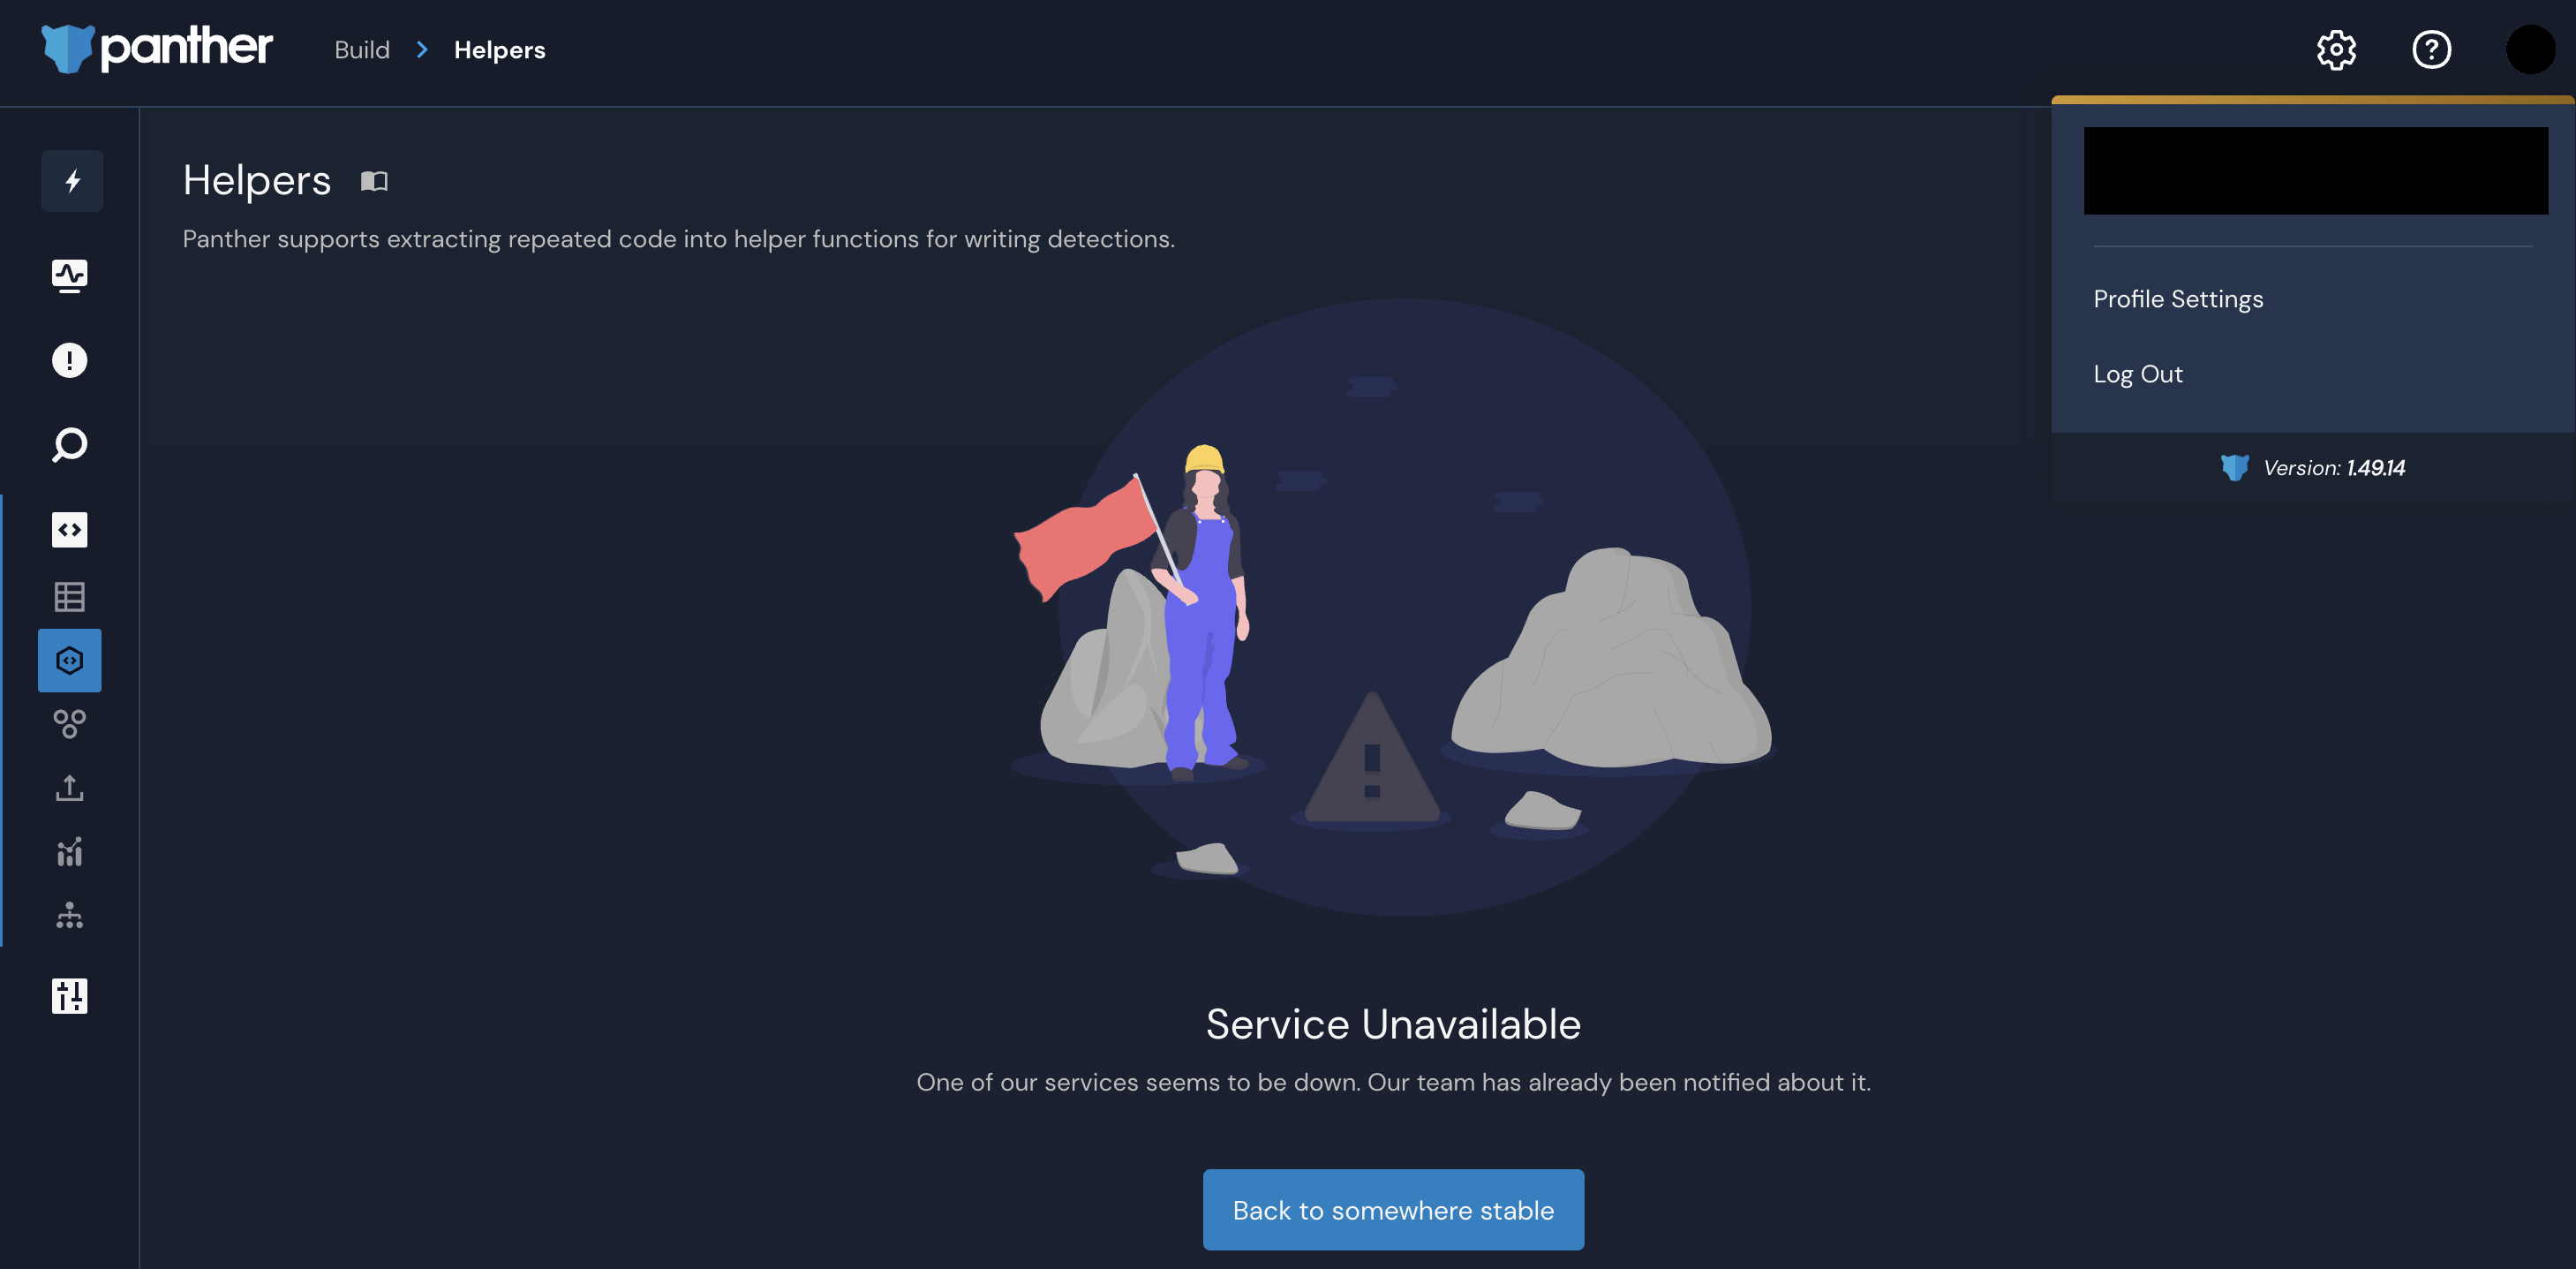
When using the Panther Console or trying to sign in, UI elements either load indefinitely, or immediately display "Service Unavailable" (as shown in screenshot).
Resolution
To better diagnose the issue, answer the following questions:
- Is this behavior specific to me, or are others on my team seeing the same thing?
If these issues are only happening to you, then the problem is likely local to your machine. Try accessing Panther from another machine (on another network, if possible). If you are able to successfully use Panther on another device, try clearing the cache on your original one and performing a hard refresh (cmd+shift+r/ctrl+shift+r). If that doesn't work, try accessing Panther through a private window, with all non-essential browser extensions disabled. Failing those, continue to the next steps.
If others on your team are experiencing the same issue, please report the issue to Panther's support team! - Am I using an adblocker, such as PiHole, DNSBL, or a browser extension, or a VPN?
Some of the endpoints Panther uses for feature rollout and monitoring can be flagged by anti-advertisement software. Try temporarily disabling the software and accessing Panther. If you are successful, then you'll need to add some exception rules to your adblocker.
- Does my firewall restrict access to some endpoints?
Same as the point above, some endpoints used by Panther can be erroneously blocked by some firewalls. Try accessing Panther with the firewall disabled; if successful, check your firewall's logs or settings to see if any of the blocked endpoints are used by Panther. The most common ones are:
-*.runpanther.net
-*.split.io
-*.intercom.io
-*.browser-intake-datadoghq.com
-*.sentry.io
- Am I running a query that exceeds the Data Explorer search limit of 100mb?
This page appears when you run a query that exceed the search limit of 100mb. If this happens, please see our Best practices for faster querying of data in Panther article. However, if you have already optimized your query and are still experiencing the same issue, please reach out to our support team for further assistance.
Cause
The symptoms described above are usually caused by the inability of our web client to reach an endpoint. When this happens, Panther may become "stuck" waiting for a response, or be unable to display any content (instead rendering the "Service Unavailable" view). Additionally, similar symptoms can be experienced when viewing the Panther Console during a backend deployment; in these cases, the loss of access is transient and typically resumes within minutes.