Where can I find troubleshooting information when I receive a System Error alert in Panther?
QUESTION
I just received an alert from Panther about a system error. The alert page only shows the destinations where the alert was sent, but I want information about the system error so I can troubleshoot the error. Where can I find this information?
ANSWER
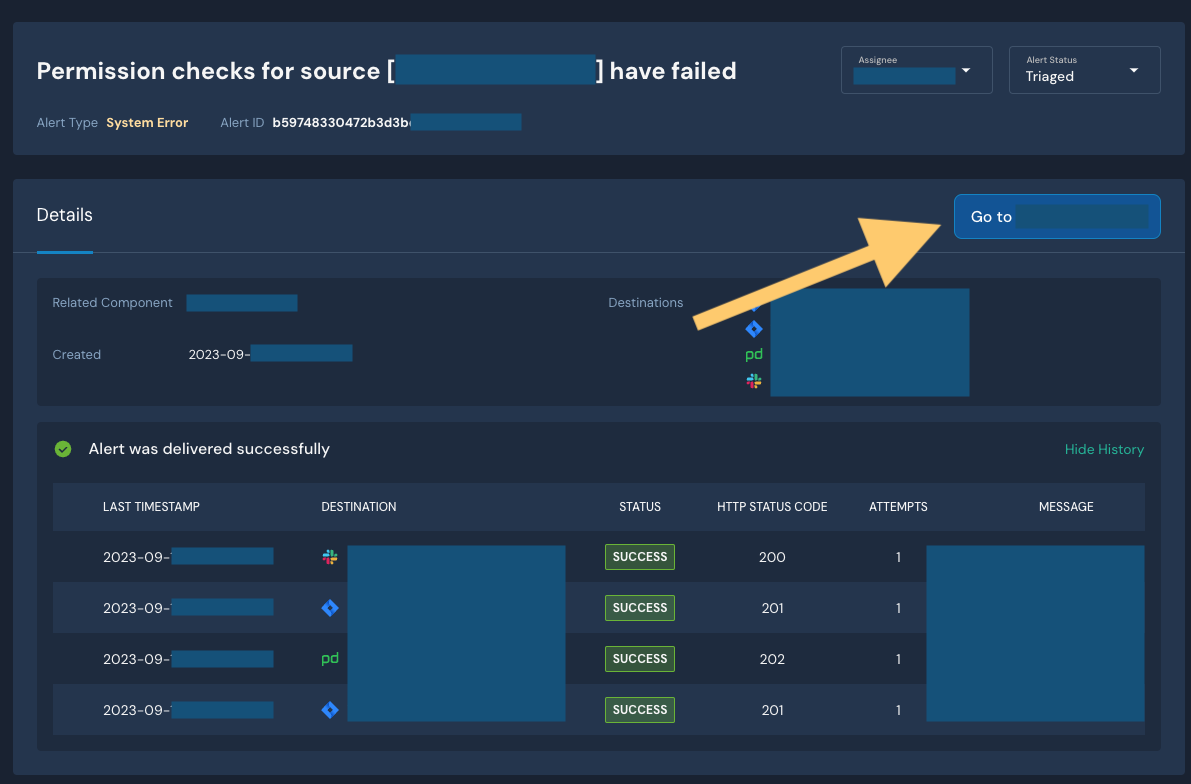
To find more information about the system error, click the "Go to Log Source" button on the alert page, where "Log Source" is the name of the log source that was involved in the system error.
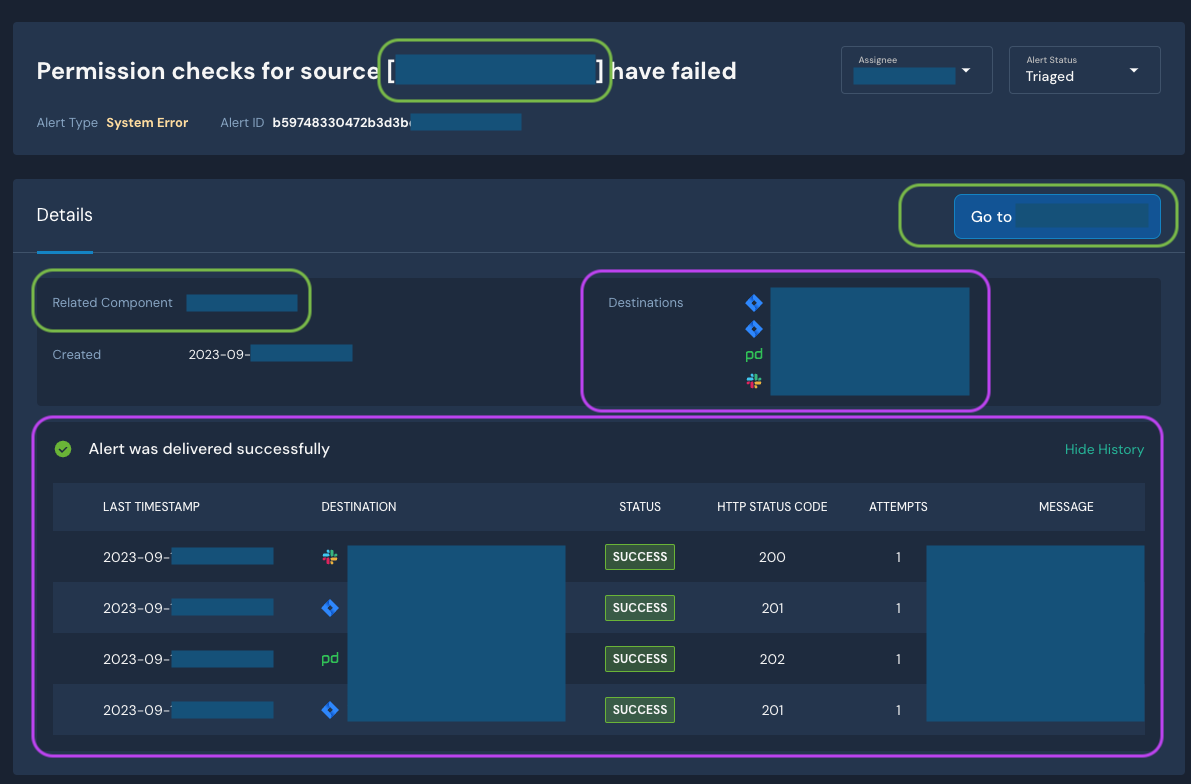
For example, this confusion may arise when a Slack log source and a Slack alert destination are both connected to the same Panther system. In this scenario, a system error that involves the Slack log source may trigger an alert that is sent to the Slack alert destination, resulting in an alert page that looks like the screenshot below.
When a log source of any kind (Slack, S3, Azure Blob Storage, etc) has a problem, Panther sends an alert to configured destinations, of any kind (Slack, Jira, PagerDuty, etc). When Panther is choosing where to send the alert, it doesn't care what kind of log source is having a problem.
In the example below, the items marked with green relate to the issue being reported, and the ones marked with pink have nothing to do with the issue being reported, rather they're only concerned about who was notified / where the alert was sent.
If you happen to be using the same Slack workspace as both a log source (Slack Production) and an alert destination (<#C0484K44D16|> Slack Channel), that's simply coincidental and this alert doesn't know the systems are similar.