Panther log classification errors troubleshooting guide
QUESTION
I see a System Health Notification alert for a log source, such as the following:
Source has turned Unhealthy
Log(s) cannot be properly classified into attached schemas
I want to see a sample of alerts to investigate the logs or schemas involved. How can I find out what this classification failure alert is for?
ANSWER
- Open the Panther Console and go to Configure > Log Sources.
- Find an alert from the log source in question, by scrolling or typing the name of the source in the box at the top that says "Filter Log Sources by text."
- Once you've found an alert, look at the end of its error message and click the "View Alerts" link there. This can reveal additional information about the state of the log source.
Alternatively, in the Data Explorer, use this query to check for new classification errors:
select * from panther_monitor.public.classification_failures
 where p_occurs_since('48 hours') -- adjust as needed
 and p_source_label = 'Your log source name'
 order by p_parse_time desc
 limit 10
Classification Errors Explained
error: This will help identify which fields are causing the log event and schema to not classify (normalize) with each other.id: This is the schema that failed to classify (normalize) with the log event.payload: This is the log event that failed to classify (normalize) with the schema.
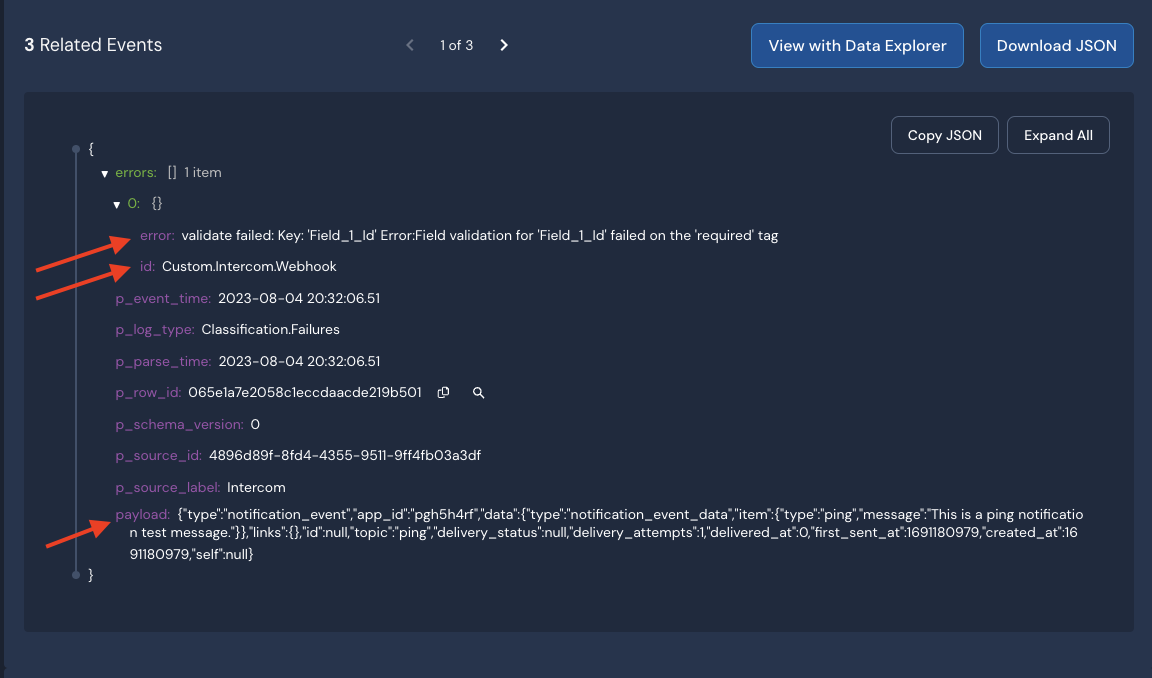
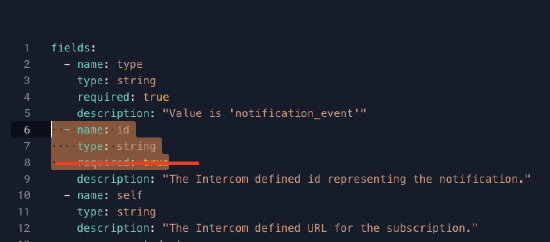
In this example, the error is saying that the schema Custom.Intercom.Webhook is expecting Field_1_Id as a required field in every log event. In the payload, there is no valid Id field which is causing the classification error. Removing the required: true tag from the schema, as shown in the screen shot below, should resolve this classification error.
Troubleshooting for Panther Supported Logs
- Confirm that the payload is similar enough to the schema (
id).- Errors may occur due to the third party's latest updates which includes adding or deprecating fields from their latest log versions.
- Once confirmed, please provide the fields above
error,idandpayloadfor Panther Support to also verify and then make changes to the Panther Supported Log Schema.- Any release notes or updated documentation that states there have been changes to the logs from the third party will help Panther Support make the necessary changes.
- Make sure you are using Auto as your log stream type.
Troubleshooting for Custom Logs
- Please confirm that the payload is similar enough to the schema (
id).- Errors may occur due to the third party's latest updates which includes adding or deprecating fields from their latest log versions and/or your S3 source may be ingesting metadata payloads to which no schema was created for.
- Once confirmed, users check the
erroragainst yourpayloadand schema (id) to resolve the classification error. - If you still need help troubleshooting, please provide the fields above
error,payload and entire schemafor Panther Support to take a look. Here's an example of the entire schema:-
fields:
  - name: type
    type: string
    required: true
    description: "Value is 'notification_event'"
  - name: id
    type: string
    required: true
    description: "The Intercom defined id representing the notification."
  - name: self
    type: string
    description: "The Intercom defined URL for the subscription."
  - name: created_at
    type: timestamp
    timeFormats:
        - unix
    isEventTime: true
    required: true
    description: "The timestamp the notification was created."
  - name: topic
    type: string
    required: true
    description: "Corresponds to a topic."
  - name: data
    type: object
    required: true
    fields:
      - name: item
        type: json
        description: "The data associated with the notification, which will have a 'type' field."
-